GAME STATUS DISPLAY
|
| |
YEAR displays
actual year.
TIME PROGRESS BAR indicates time
left till year changes / next round starts.
|
| |
|
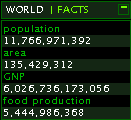
INFO PANEL
|
| |
prints absolute values of some parameters
for currently selected region
(or the world, if no region is selected).

|
| |
|
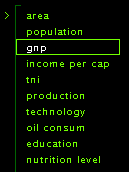
PARAMETERS MENU
|
| |
choose the parameter you want to be displayed
on the map and the graph.

|
| |
|
MAP MENU
|
| |
choose your prefered type of visualization
between:

WORLD MAP
abstracted geographic world map
currently selected parameter is transposed to country size.
"classical" BAR CHART
NORTH & SOUTH
abstracted geographic world-divide map
measures and draws distinctions between regions as north/south
divide.
all values are normalized and indicate relative proportions.
|
| |
|
MAP
|
| |
select a region by click.
click on any ocean territory to de-select current region.

|
| |
|
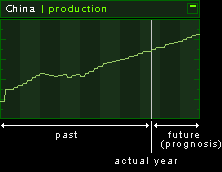
GRAPH
|
| |
displays selected value of current region
(or world) as a function of time.

|
| |
|
CONTROL PANEL
|
| |
edit and change parameters of currently selected
region
(actual year).

green bars indicate your proposed value.
grey bars indicate present value calculated by all user's contributions.
editable parameters are:
target investment
distribution
indented distribution of investment on the sectors industry,
agriculture, hightech and other
food aid
percentage of food surplus that will be provided as (development)
aid
financial aid
percentage of utilities surplus that will be provided as (development)
aid
all values are immediately re-calculated after release of the
mouse button.
to examine possible effects on one of the world maps (or bar
chart) your display year must be set within the prognosis period.
(see timeline)
|
| |
|
TIMELINE
|
| |
click or drag the slider to manipulate the
year you want to be displayed.

|
| |
|
RESET BUTTON
|
| |
resets all changes you have done.
|
| |
|
SUBMIT BUTTON
|
| |
sends your proposed values to the server.
only one submission per round and user is allowed.
|
| |
|
EXIT
|
| |
logout and exit here !!!
|
| |
|
FORUM
|
| |
[./ logicaland]'s communication tool from
user to user.
post, read, discuss etc..
|
| |
|
TROUBLES ?
|
| |
still questions? techncial troubles?
mailto: sos@logicaland.net
|
| |
| |


